-
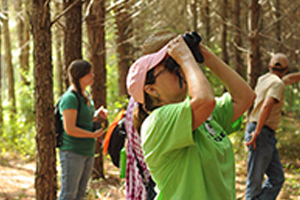
What Can Trees Tell Us About Climate Change?
Learn about the connection between trees and climate change, how tree rings can tell a story about past weather events, and the methods by which scientists are recording this data. What Can Trees Tell Us About Climate Change? is a resource offered by NASA’s Climate Kids, designed for upper-elementary students. Find images, fact sheets, activities, games, and articles on this and a variety of other topics—including the atmosphere, water, energy, and weather—to help tell the story of our changing planet in ways that are accessible and engaging.
-
How Much Hotter is Your Hometown Than When You Were Born?
This Interactive Climate Change Model, developed by the New York Times, asks: How much hotter is your hometown than when you were born? Global temperatures continue to rise each year and in many parts of the world temperatures above 90 degrees Fahrenheit will become more frequent. Discover how much warmer your hometown is now than when you were born and investigate future projections.
-
SeedSmart
Teachers and students can use SeedSmart to find answers to basic questions about a site you might be wanting to restore. Some of these questions include: Which species are native here? What are the important soil characteristics I should know about? Which plants grow best in this setting? Which plants will be more likely to thrive under changing climatic conditions? The tool is compatible with any smartphone or browser and allows users to zoom in to their local ecosystem and determine the mix of native species that are best suited for a particular site. This first of its kind, all-in-one web application was developed by NatureServe, an international biodiversity conservation organization.
-
Bill Nye Saves the World
Have a Netflix account? Bill Nye (The Science Guy) is staring in a new Netflix original series, Bill Nye Saves the World. The first episode “The Earth is a Hot Mess” discusses climate, how greenhouse gases affect our climate, and the science behind global climate change. Each episode is roughly 30 minutes long, includes short clips, panel discussions with experts, and covers a variety of science-related topics.
-
Carbon Cycle: A Musical
This Carbon Cycle Song and accompanying materials can serve as a great introductory activity to the carbon cycle. The Carbon Cycle Song teaches students about the movement of carbon through the environment, as well as different processes that carbon undergoes to change pools. Accompanying materials include a quiz and brief background information.
-
Climate and Health
Developed over three years by experts in climate-change science and public health The Impacts of Climate Change on Human Health in the United States: A Scientific Assessment examines how climate change is a significant threat to our health.
-
The Story of Climate Change – Free Interactive Textbook for Grades 5-8
Earth Day Network has published The Story of Climate Change, an interactive, digital textbook for middle school students. Use this iTextbook with grades 5-8 to teach climate science through multimedia resources that allow students to explore videos, graphs, and animations of forests, coral reefs, and glaciers with a touch of the screen. The book is available for download with iBooks on your Mac or iOS device. A Teacher’s Guide is also available on Earth Day Network’s website. It includes in-depth activity lesson plans, Next Generation Science Standard Alignments, student action plans, and handy resources to help educators make the most out of every chapter.
-
Interactive Map Shows World’s Changing Forest
Curious about how forest cover has changed during the past several years in your area- or beyond? This interactive online map allows you to see forest loss around the world. Researchers found that the dynamics of forests in the south-east United States are unique. As a result of an intense cycle of tree planting and harvesting, the disturbance rate in this area was four times that of South American rainforests during the study period (2000-2012). The map displays not only forest cover (green), but also areas of forest loss (red), forest gain (blue), and places where there was both loss and gain (purple) over this time period.
-
Identify Trees from Leaves
Leafsnap is a free app that uses visual recognition software to help identify tree species from leaf photographs you take in the field. Leafsnap currently focuses on tree species found in the Northeastern United States and Canada, but expansion is underway to include all U.S. regions.
-
Climate Change around the World
An article in BBC News that discusses impacts of global warming in countries around the world and in major sectors of society: health, water, food, ecosystems, coasts, and industry.
-
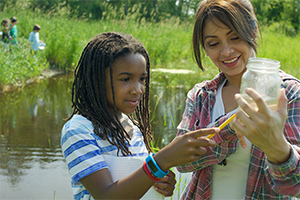
Water Calculator
The H2O Conserve Water Calculator is a short survey that will get you thinking about how much water you use, and how water connects to almost every aspect of your life. The Conserve Water Calculator compares individual daily water usage with the national average. It also provides suggestions of how to save more water using improved practices. Beyond the calculator, the site provides valuable educational materials and activities to engage students in water conservation issues.
-
Climate Change and Carbon Sequestration
Check out these 15 pre-made climate change statements that work as great discussion prompts with this activity.
-
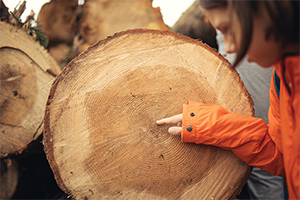
The Smithsonian Institution’s Tree Banding Project
Citizen science programs involve students and teachers contributing to ongoing scientific work. Sign up to participate in The Smithsonian Institution’s Tree Banding Project and contribute to research about tree biomass, and how trees respond to climate. Students around the globe will monitor the rate at which their local trees grow, and learn how that rate corresponds to Smithsonian research, as well as compare their work to other students worldwide. Schools will be selected for participation based on location and when they apply. If selected, the Smithsonian will mail a kit that includes everything students will need to get started.
-
International Carbon Footprint Challenge
International Carbon Footprint Challenge unites high school students worldwide as they calculate their individual footprints using an online “footprint calculator” and post class data on a world map. Students then enter discussions about their footprints and how to work toward solutions to globally shared environmental issues.
-
IMOLD: The Interactive Model of Leaf Decomposition
This University of Toledo project intended for grades 9-12 teaches students about leaf litter decomposition and how it relates to the Earth’s carbon cycle and climate. Using interactive tools, the website allows students and teachers to create their own animated models that display tree leaf litter decomposition rates for species of their choice and compare them to other species and different environments.
-
Ring of Fire
WildFIRE PIRE is a project of the Montana State University, involving an international team of scientists putting the past, present, and future of wildfire into global perspective. The group will use thousands of years’ worth of historical data on landscape vegetation, fire, human behavior, and climate to build a computer simulation to understand how future changes in climate and human factors might affect vegetation patterns in global forests. To learn about their process and findings, you can read more here.
-
Changes in the Air: Seeing Trends, Coalition Works to Help a River Adapt
To prepare for changes along Washington state’s Nisqually River, tribal leaders, private partners, and government agencies are working to help the watershed and its inhabitants adapt. Read more about how agencies work together in this article.
-
EasyMeasure
A free app that can be downloaded onto Apple devices (SmartMeasure for Android). EasyMeasure uses the height of the camera lens and its tilt angle to calculate the distance to objects of your choice. Simply aim your mobile device at any object, and this app displays the distance towards that object on top of the camera image. Upgrades can be used to also calculate object height.
-
Zero Carbon
A free app that can be downloaded for Apple devices. Zero Carbon can calculate an individual’s carbon footprint by looking at a person’s daily habits. Once you know the amount of greenhouse gases your lifestyle is producing, this app offers tips on reducing that number. Zero Carbon also shows how your statistics stack up against world averages, and it can be connected to Facebook, for sharing results.
-
Easy Chart
A free app that can be downloaded onto Apple devices. This is a good tool for teachers and classrooms. Easily create bar, line and pie charts that you can customize, save and e-mail or upload. The charts you create can be saved using multiple color schemes and in multiple sizes. The app also works without an internet connection.
-
EnviroAtlas
EPA’s new EnviroAtlas tool is designed to help communities and researchers make informed planning and policy decisions related to the environment and ecosystems. EnviroAtlas provides datasets and interactive tools to allow users to explore the many benefits people receive from nature, often referred to as ecosystem services. EnviroAtlas includes over 300 data layers, letting users analyze how decisions affect ecosystems and their ability to provide goods and services. Key components include:
-
Global Forest Watch
Global Forest Watch (GFW) is an interactive online forest monitoring and alert system designed to better visualize forest change across the globe. Developed by the World Resources Institute and partners, Global Forest Watch monitors forests across the world in near real time to show where trees are growing and disappearing. The system provides contextual data that fleshes out complex issues surrounding deforestation. It can be utilized by teachers for classroom demonstrations and activities, and by students for research.