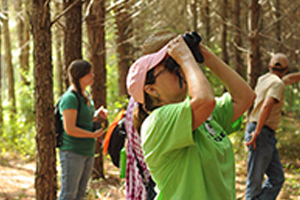
Getting to know what is happening in a particular habitat is much like exchanging letters with a Pen Pal. When communicating with a Pen Pal, you most likely will share a little about what is going on in your present-day life and in your neighborhood.
In Activity 7, Habitat Pen Pals, found in Project Learning Tree’s PreK-8 Environmental Education Activity Guide, students learn about the diversity of habitats around the world and write letters from the perspective of organisms living in these habitats.

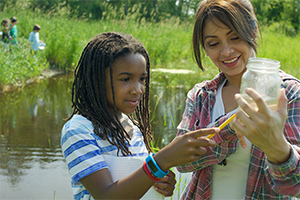
Take PLT’s Habitat Pen Pals activity a step further with these STEM-focused enrichment ideas.
Essential Question: What is happening to the habitats where you live?
Task: Use the activity ideas below to:
- Define a local habitat,
- Investigate the different types of animals found in these habitats,
- Engineer a wildlife corridor, and
- Apply math to manipulate a computerized model.
NGSS Connections:
- 3-LS4-3: Interdependent Relationships in Ecosystems: Environmental Impacts on Organisms – Construct an argument with evidence that in a particular habitat, some organisms can survive well, some survive less well, and some cannot survive at all.
- MS-LS2-1: Ecosystems: Interactions, Energy, and Dynamics – Analyze and interpret data to provide evidence for the effects of resource availability on organisms and populations of organisms in an ecosystem.
- MS-LS2-4: Ecosystems: Interactions, Energy, and Dynamics – Construct an argument supported by empirical evidence that changes to physical or biological components of an ecosystem affect populations.
Stem Strategies
Science:
What is a habitat? This 11-minute video covers some essential habitat concepts, including:
- The place a plant or animal lives is called a habitat.
- Living things get food, water, and shelter from their habitat.
- There are many different habitats on Earth.
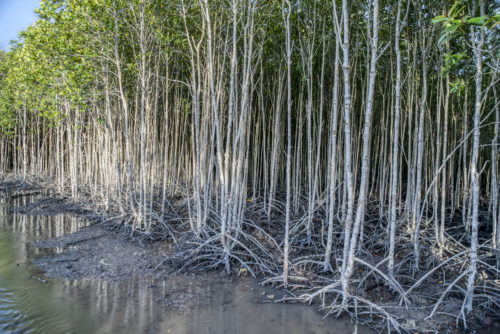
Which type of habitat would you want to spend your time living in, a terrestrial (land) or aquatic (water) habitat? Pick the one you like most (terrestrial or aquatic) and a species of animal you would find living in that habitat.
When scientists examine a habitat, they identify the sources of food, water, and shelter that it provides to the animals that live there. Imagine you are the animal you selected and living in the habitat you chose. Write a letter to your pen pal to describe the three essential elements of your habitat:
- Food: What kinds of things you eat and where you find them,
- Water: The type and quantities of water sources you have available, and
- Shelter: The place you prefer to use for sleeping and hiding (during storms or if a predator is nearby).
Technology:
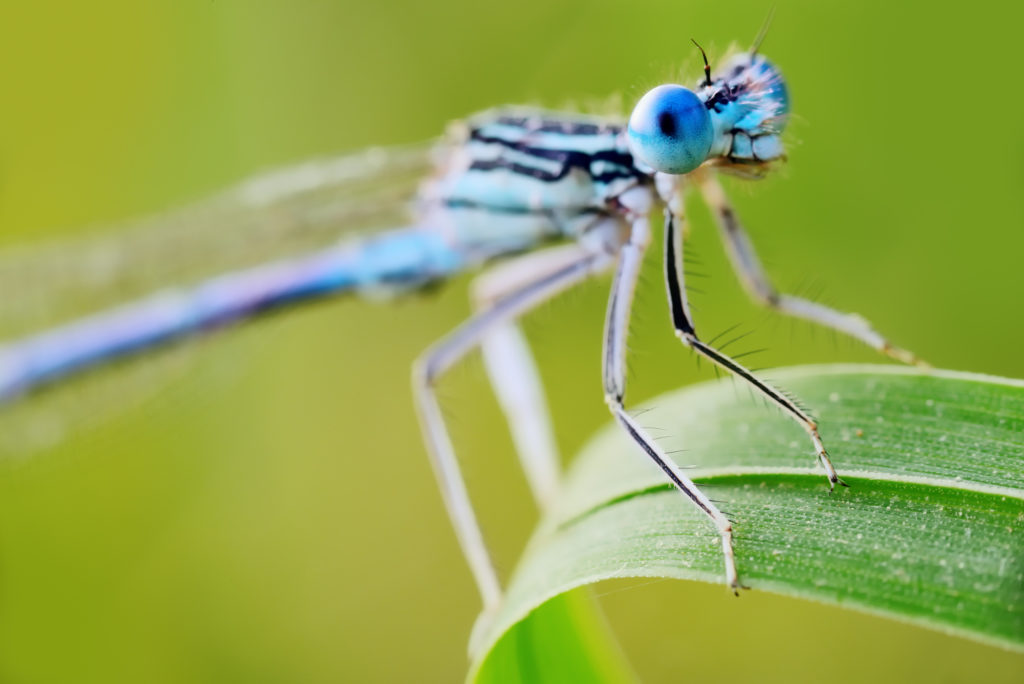
Plants and animals are part of any habitat, and each has its own unique story. To better understand species and habitats, scientists develop a document called a “species account.” A species account can use images but must also include written text. Here are a few great examples about damselflies.
Select a species from your habitat and use graphic software to display the information found for your species.
Here is a list of items that may be included in your species account. Remember that authors use scientific literature to support their writing, so you should too:
- Characteristics – color, size, appearance of different ages
- Distribution – geographic range, elevation preference
- Ecology – population (density, longevity, and dispersal), habitat type, diet, diseases, and interactions (predation, predator avoidance, associated species)
- Behavior – group dynamics, territoriality, dominance and play, vocalizations, scent-marking, hibernation, grooming
- Conservation – habitat and threat management
Here are suggested online, collaborative resources to create your species account:
- Jamboard – https://jamboard.google.com/
- Quick, Draw – https://quickdraw.withgoogle.com/
- Smore – https://www.smore.com/
- Other apps and websites for making posters/collages
Engineering:
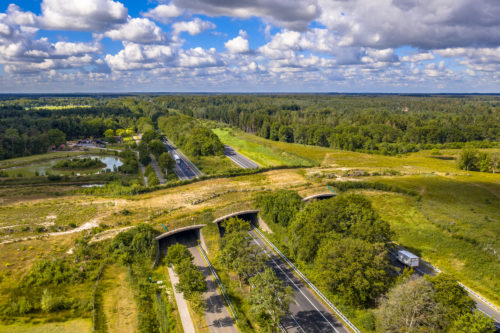
Wildlife corridors are areas of habitat that connect different patches of vegetation. These “nature highways” can reconnect fragmented areas to enable species to move more easily in search of food, partners, and habitat. They can range in size from very small corridors that link two patches of forest to large corridors that span thousands of miles.
Save, project, or print out a large satellite map using Google Earth showing your school or home and the surrounding neighborhoods. Label the core habitat areas (i.e. areas with good vegetation cover, parklands, forests, etc.) and potential barriers to movement (i.e. roads, lawns, buildings, etc.)
Your challenge is to design a wildlife corridor to help reconnect your landscape.
Select parts of the map where you think habitat should be reconnected, then apply and resize free clip art images (such as forests, trees, shrubs, fences) to build your own wildlife corridor.
Wildlife corridors can be created by:
- Planting trees or shrubs to link different habitat patches.
- Retaining or planting strips of vegetation along roadsides and fences to connect habitat patches.
- Sensitively designing urban parks and gardens to conserve and maintain habitat for native species.
- Linking national parks and protected areas with surrounding habitat patches.
- Establishing wildlife crossing structures across major roads.
- Creating biodiverse, wildlife friendly gardens.
- And more!
Math:
Scientists use mathematical models for many things. To assess habitat and related impacts, models can be used to predict population growth of plants and animals over time. Learn more about population growth and take the quiz at the end to test your knowledge.
When there are no constraints (such as competition or disease) on population growth, a population will experience what is referred to as exponential growth. It will keep increasing. When resources are limited for a given habitat (food, water, shelter), the population growth rate slows down to almost zero, and this represents the carrying capacity for any given habitat. This slowing of growth is known as logistical growth and produces an S-shaped curve, known as the logistic curve.
Identify the exponential growth curve and the logistical growth curves on this graph.
Curve that follows “Red X’s” = ? Curve that follows “Blue Dots” = ?
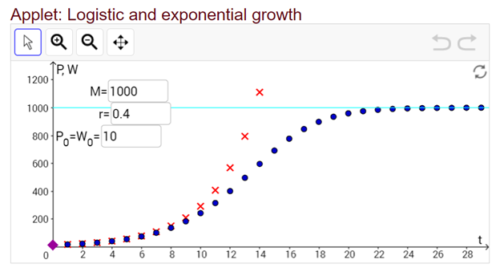
This model demonstrates both logistic and exponential growth of a population.
The variables for this model are:
M = Total number of individuals at maximum carrying capacity (light blue line)
r = Rate of growth over time (expressed as percentage)
P0=W0 = Starting population
Curve that follows the “Blue Dots” = Logistic growth
Curve that follows the “Red X’s” = Exponential growth
Now it is up to you to interpret what this graph means. To do this, use the data information found in the boxes in the upper left-hand corner of the graph. Remember, the x-axis is the horizontal scale (0-28) and the y-axis is the vertical scale (0-1200).
Without changing any data, note the following:
- At what time does the exponential growth curve intersect the carrying capacity line?
- When does the logistic growth curve intersect the carrying capacity?
Now, let’s make some minor changes and observe what happens.
- Keep M = 1000 but change r to 0.2. Remember, r equals the percent rate of growth of the population for each time period. What happens to the curves?
- Just change r to 0.6. What do you observe?
- Keep M = 1000 and r = 0.4 but change P0=W0 to any number you like but keep it under 50. What do you observe? When does logistic and exponential reach carrying capacity?
Continue to change the values and observe the model. What did you learn about the species and the habitat portrayed in this scenario? Discuss and debate how can models like this one help with biodiversity management and conservation?
Get PLT’s PreK-8 Environmental Education Activity Guide
Be sure to check out the full activity, Habitat Pen Pals, found in PLT’s PreK-8 Environmental Education Activity Guide.
- Purchase a print guide or e-book, available from PLT’s Shop, Amazon, and other places where books are sold.
- Get it through your PLT State Coordinator along with hands-on professional development, alignments to state standards, and other state-specific supporting resources.