 How do animals living in our backyards or schoolyards get what they need to live? Use modeling to investigate the animals in your neighborhood and how they get the food, water, and shelter they need. Remember that habitat is where a plant or animal gets everything it needs to survive.
In science and engineering, a model represents an idea, object, process, or system that is used to describe and explain events that can’t be experienced directly. Scientists and engineers use modeling in many ways. Models can help visualize thinking, distill complex ideas, test hypotheses, organize data, or communicate results or concepts.
Different types of models include:
- physical replicas, such as a map or a model car
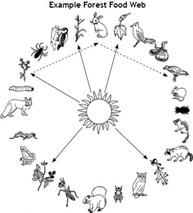
- diagrams, such as a drawing of the water cycle or a food web
- mathematical representations, such as a bar graph or equation
- computer simulations, such as a weather forecasting app or flight simulation
Modeling is an important STEM skill for young scientists as well. Through modeling, learners can describe, explain, and predict events, and communicate scientific ideas to others.
These enrichments accompany “Backyard Safari” on page 29 of Project Learning Tree’s Explore your Environment: K-8 Activity Guide. Be sure to check out the full lesson!

 Essential Question: How can models help us better understand what animals live outside our school or home and what makes a good habitat?
Task: Use these experiences to
- Quantify and organize data
- Use technology for modeling
- Practice making models to convey new ideas or solutions
NGSS Connections:
- K-ESS3-1: Natural Resources – Use a model to represent the relationship between the needs of different plants or animals (including humans) and the places they live.
- 2-LS4-1: Unity and Diversity – Make observations of plants and animals to compare the diversity of life in different habitats.
- K-2 Science and Engineering Practice: Modeling – Develop and use a model to represent amounts, relationships, relative scales (bigger, smaller), and patterns in the natural and designed worlds.
STEM Strategies
Science:

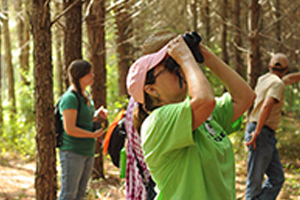
Wildlife biologists are scientists who study how and where animals live, what they do, and their populations. Their research often takes them into the wilderness, where they observe animals and their roles in the ecosystem. They often use models to understand the life histories of animal species, ecosystem interactions, and how humans influence habitats.
You can create a diagram model of your schoolyard or backyard habitat that shows where animals get the food, water, and shelter they need to live. Start with a paper plate and crayons or colored pencils.
Spend time in your schoolyard or backyard to look for sources of food, water, and shelter for the animals living there. Using the paper plate, draw a diagram or picture of your habitat. Include where animals get food, water, and shelter. Add plants, animals, or other features you’d like others to know about.
Share your diagram with someone else. Point out how the habitat provides animals with the necessities they need to live. Ask: What was easy or hard about making your diagram? What did your diagram teach you about habitats? What could you do to improve the habitat?
Technology:
Computer simulation models can help wildlife biologists learn about different animals and their behaviors.
Check out PBS Plum Landing’s Nature Changer game for a kid-friendly computer simulation. In this game, you are a wild animal needing to survive in your habitat. You may be looking for food or materials for your nest or forming groups to stay safe. After choosing which animal you want to be, you can choose an easy or hard version of the game. If you select “Make Your Own,” you can use the sliders to set up the conditions for your own simulation.
After playing around with the simulation, ask: What does this model demonstrate about animals and their habitats? How is this model similar to or different from the real world? What would make it more realistic?
Math:
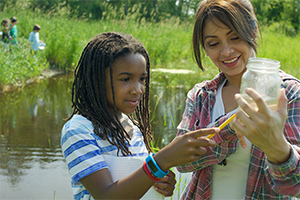
Wildlife biologists collect data about the animals they find and use graphs and other mathematical tools to help them understand the data and share it with others.
You can create mathematical models for the animals you find in your schoolyard or backyard. Using sticky notes that are all the same size, draw a picture of a different animal on each note. On the board or a piece of paper or cardboard, draw a line for the bottom of the graph.
For each round, group the animals according to the following criteria. Make a column of sticky notes for each group—starting on the line you drew—to make a bar graph. Count and record the number of animals in each group. Remove the animals for the next round.
- Round 1: Type of covering (hair, feathers, scales, or shell)
- Round 2: Wings or no wings
- Round 3: Number of legs (0, 2, 4, 6, 8, or more)
Ask: Which groups of animals did you find the most of? What might that tell you about your school or backyard habitat? Are there any groups of animals you would want to encourage or discourage? How?
Additional Resources
- Interested in PLT’S Explore Your Environment: K-8 Activity Guide? Sign up for a workshop – either in person or online.
- Nonformal educators can use PLT’s Nature Activities for Families to teach learners about the outdoors. We have 40+ nature activities for families that can be easily used by parents, grandparents, youth group leaders, nature centers, and other nonformal programs.
- Download the Backyard Safari activity for Grades K-2 to help students observe habitats nearby.
- Get kids outdoors with STEM: Get Outside to investigate nearby environments!