 Have you ever sat quietly in a familiar place and listened to the sounds, breathed in the smells wafting through the air, or used your sense of touch to feel the different textures of everything around you? We use our senses (sight, smell, touch, sound) every second we are awake, but have you ever thought about using them as part of an experiment? This activity allows you to use your senses and count, or quantify, how things change from one place to another.
These enrichment ideas accompany the Get Outside! activity found in Project Learning Tree’s Explore Your Environment: K-8 Activity Guide. Be sure to check out the full activity!

Essential Question: In what ways can scientific research be applied both indoors and outdoors?
Task: Use these experiences to:
- Enhance skills in writing scientific questions
- Explore software tools for organizing and analyzing data
- Apply design thinking skills to the creation of a new product
- Collect quantitative data using sensory experiences
NGSS Connections:
- 3-5-ETS1-2: Engineering Design – Generate and compare multiple possible solutions to a problem based on how well each is likely to meet the criteria and constraints of the problem.
- 5-ESS3-1: Earth’s Systems – Obtain and combine information about ways individual communities use science ideas to protect the Earth’s resources and environment.
STEM Strategies
Science:
A scientist is someone who systematically gathers and uses research and evidence to make hypotheses and test them to gain and share understanding and knowledge. Scientists must be able to construct good scientific questions. Good scientific questions are ones that can be answered by an experiment and typically begin with words such as “What,” “How,” or “Why.” A question that can be answered with a simple “yes” or “no” is not a good scientific question.
Use this short guide to Asking Good Scientific Questions from the University of Kentucky’s College of Agriculture, Food, and Environment to develop your skills in developing good scientific questions.
Technology:
Data collection is an important part of being a scientist. Scientists use computer software tools to be more efficient and to reduce errors. Scientists create spreadsheets using software like Microsoft Excel to organize data in rows and columns and then analyze and categorize the data based on their needs.
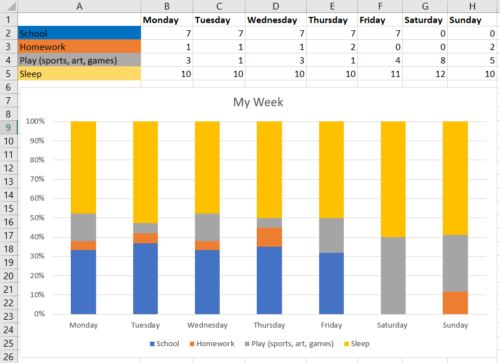
Here’s an idea for collecting your own data: For each day of a week, record the number of minutes you sleep, play, and study. Place the days of the week across the top (in the lettered column headings) and your activities, such as sleep, play, and study down the left side (in the numbered rows). Track and record your data daily. To create your own data set in a software program like Microsoft Excel, open a “blank workbook” and begin entering your data. Try using different types of charts to create a visual representation of your data. See example below.
Don’t have access to Microsoft Excel? No problem! Try one of the following free online programs to organize and manipulate your data using spreadsheets:
Engineering:
Have you ever wished you could bring elements of the outside indoors and vice versa? As you might have guessed, many market-based products are designed to do just this! For example, an air freshener might make your room smell like a forest or meadow (bringing the outside to the inside), and exercise videos can now virtually transport you to another place (bringing the inside to the outside).

Challenge yourself to make two lists:
- A list of things you would like to bring from the outside to inside your home (or classroom), and
- Another list of things you would like to bring from inside your home (or classroom) into the outdoors.
Think about how you might accomplish at least one item on either list. Use elements from the Design Thinking Process to design your own product that could make it happen.
Math:
Mathematics is used in science to calculate the measurements of objects and their characteristics, as well as to show relationships between different functions and properties. Scientists can work both inside and outside and also use many math skills. Let’s practice using math in a scientific setting where we collect data points from different locations, both indoors and outdoors.
First, you will need to prepare to collect your data. Select two “inside” sampling sites, which represent two different indoor spaces. For example, your bedroom (Site 1) and family room or kitchen (Site 2). Now go outside and select two additional sampling sites, such as the front of your home (Site 1) and back of your home (Site 2), or a local playground (Site 1) and a parking lot (Site 2).
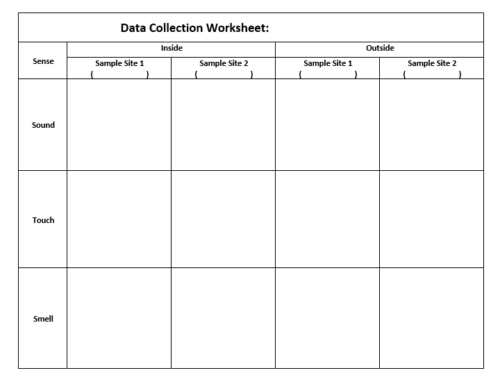
Once you have your sampling sites selected, prepare a data collection sheet (see example chart below). Inside the parentheses below “Sample Site 1,” be sure to document your chosen locations, such as bedroom and kitchen. Record the location for all sampling sites.
Now you are going to begin the process of collecting data. Use your senses other than sight — including sound, touch, and smell — to collect data.
Here’s what to do:
- SOUND: In each of your four sample sites, sit quietly for two minutes and count how many different sounds you hear at that site. Record the number of sounds in the appropriate box.
- TOUCH: While sitting in that same spot, reach out with your fingers and touch as many different textures you can. Record that number in the appropriate box.
- SMELL: Finally, use your nose to detect different smells and record this number on your datasheet. Be sure to record your data in the corresponding data box.
Once your data is collected, revisit the software detailed in the TECHNOLOGY section above. Use spreadsheet software to create a chart (or multiple charts) that displays your data. Don’t get discouraged; your spreadsheet design may need to be revised so that your data is displayed in a clear and compelling way. Try displaying the same data as both bar charts and pie charts. Which do you like better? Why?
Get PLT’s Explore Your Environment: K-8 Activity Guide
Be sure to check out the full activity, Get Outside!, found in PLT’s Explore Your Environment: K-8 Activity Guide.
- Purchase a print guide or e-book, available from PLT’s Shop, Amazon, and other places where books are sold.
- Get it through your PLT State Coordinator along with hands-on professional development, alignments to state standards, and other state-specific supporting resources.